Enabling observability for runtimes
Overview
Observability lets you send telemetry data from your runtime and integration process executions to third-party application monitoring tools that support the OpenTelemetry standard. As a runtime owner or a cloud tenant you can now stream metrics, logs, and traces, in real time, for your runtime's activity to the monitoring application of your choice.
Observability is available to all accounts and runtime types, including private clouds and cloud attachments. For Boomi-hosted DCS and MCS runtime cloud users, this feature will be rolled out gradually. Observability is not available for PCS attachments at this time.
How it works
Runtime administrators can enable and configure OpenTelemetry for individual runtimes within their account via the UI or the platform API.
For runtime clouds, cloud owners control whether their attachments can enable and export their own observability settings: either enabling the option for all attachments in the cloud or restricting it to specific ones.
Attachment-level telemetry is separate from and runs in parallel to observability configured for the entire cloud. For example, if both the cloud and an attachment have observability enabled, telemetry is sent to both endpoints. Attachment-level telemetry only includes data specific to that attachment’s activity, such as process executions and execution workers. It does not contain cloud-level telemetry such cluster node metrics or container logs.
The observability configuration provides basic filtering to manage the telemetry data sent by the runtime. Advanced filtering can be performed within the endpoint application or with the use of a collector.
There are three types of observability data.
- Metrics - Periodic snapshot of application statistics. For Boomi, metrics are currently available via JMX metrics.
- Logs - Recording of an event within the application. For Boomi, events are currently captured in log files such as the container log and process log.
- Traces - The execution path of a given request through the application. For Boomi, the closest is the process log or process state.
Learn more about OpenTelemetry and supported vendor tools.
Architecture
The Boomi OpenTelemetry feature works as a plugin within the integration runtime. The lifecycle of the plugin (as with all plugins) is completely managed by the Boomi runtime working together with the Boomi Platform to download, install, configure, and invoke the plugin. It is not an embedded agent or collector.
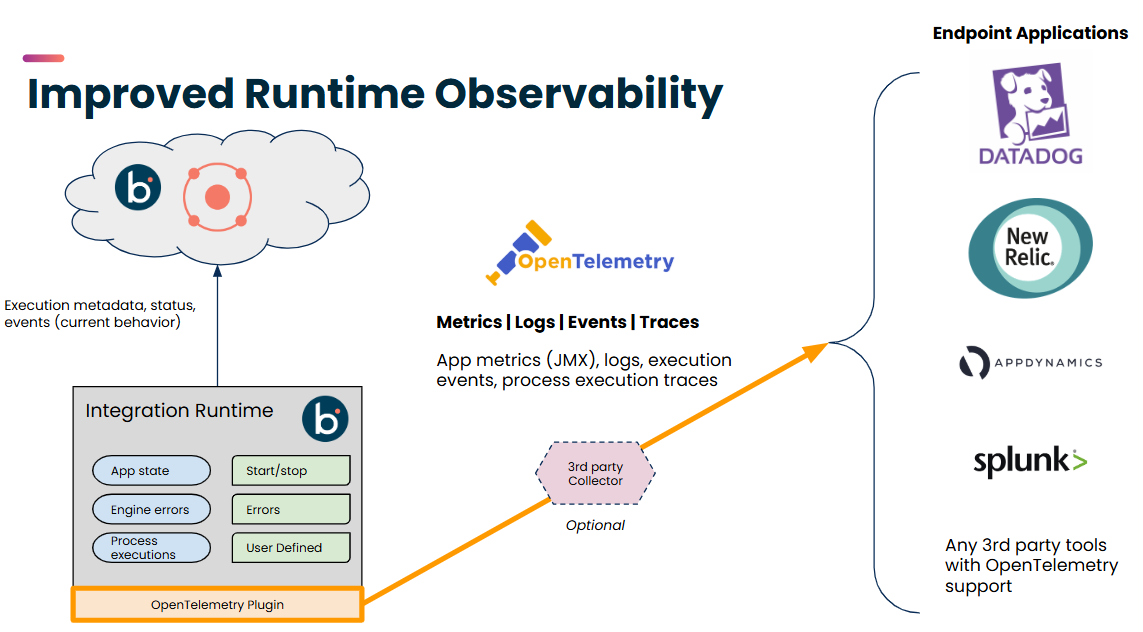
The telemetry data is communicated or “exported” directly to an endpoint application, which ingests and indexes the data so it can be used within that application. Many endpoint applications consume a mix of telemetry signals, while others are single purpose (e.g. only traces).
You do not need to install a third party agent with the runtime. However you can optionally choose to install a collector. The collector acts as an intermediary, providing a level of buffering/throttling, resiliency, enrichment, and filtering that can be useful in a production environment.
Considerations
- When observability is enabled for a runtime, it will begin transmitting all enabled telemetry data to your endpoint. This could potentially be a large amount of data depending on execution volume. Note that some monitoring tools charge by volume of data collected. You can reduce the volume of data using the available filters within the runtime configuration or filter outside of Boomi in the endpoint application or collector.
- When observability or a specific telemetry type is disabled, no telemetry data is generated.
- Delivery of telemetry data from the runtime to the endpoint application or collector is not guaranteed in the event of extended network interruptions or endpoint application availability. Although use of a third party collector can provide some level of buffering, telemetry data is not queued indefinitely for when connectivity is restored. As such, observability is not intended for critical business transaction tracing. For such tracing, alternative approaches such as emitting key business events as part of integration process design is recommended.
Supported telemetry details
| Type | Details |
|---|---|
| General |
|
| Protocol |
|
| Metrics |
|
| Logs |
|
| Traces |
|
| Authentication |
|
